Fat used in pastry NEA 1

This star profile on Youtube shows how to create a star profile on Nutrition Program to compare fats in pastries.

This video shows how to do the star profile

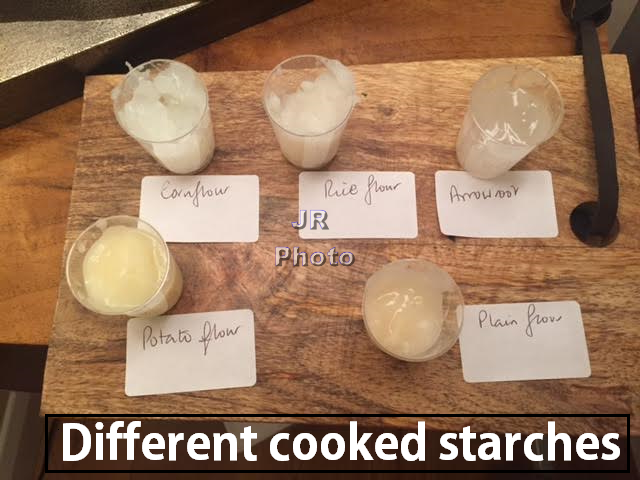
I’ve used butter, lard, Trex and oil for the pastry. Taken from book NEA1 Food Investigations 10 Tasks

And Food Science You Can Eat

Click it through and see how to do an Evaluation for NEA1

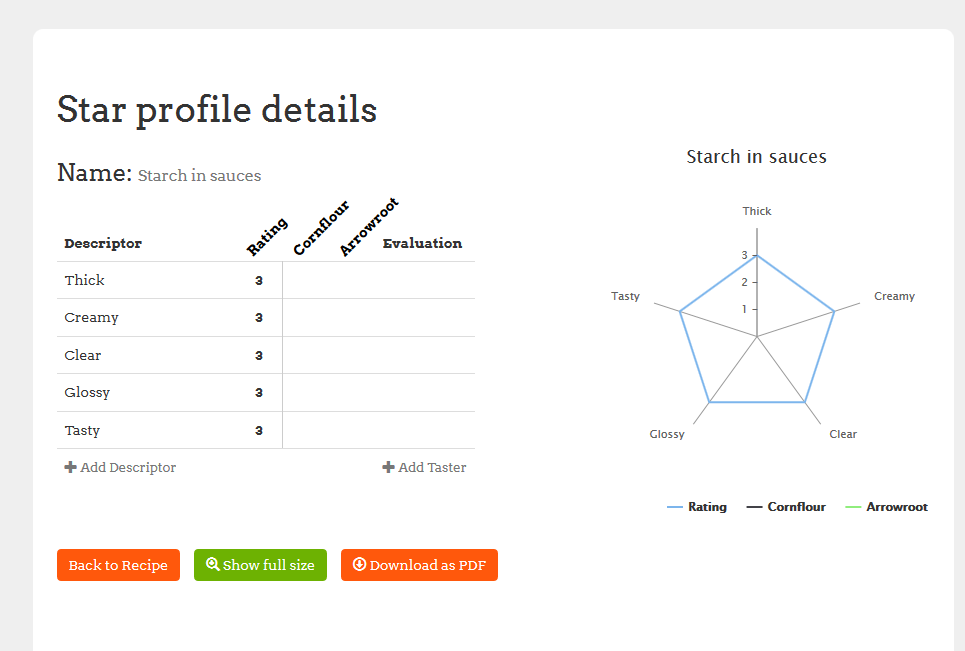
1. Starting the star profile

Youtube video for star profile for pastry

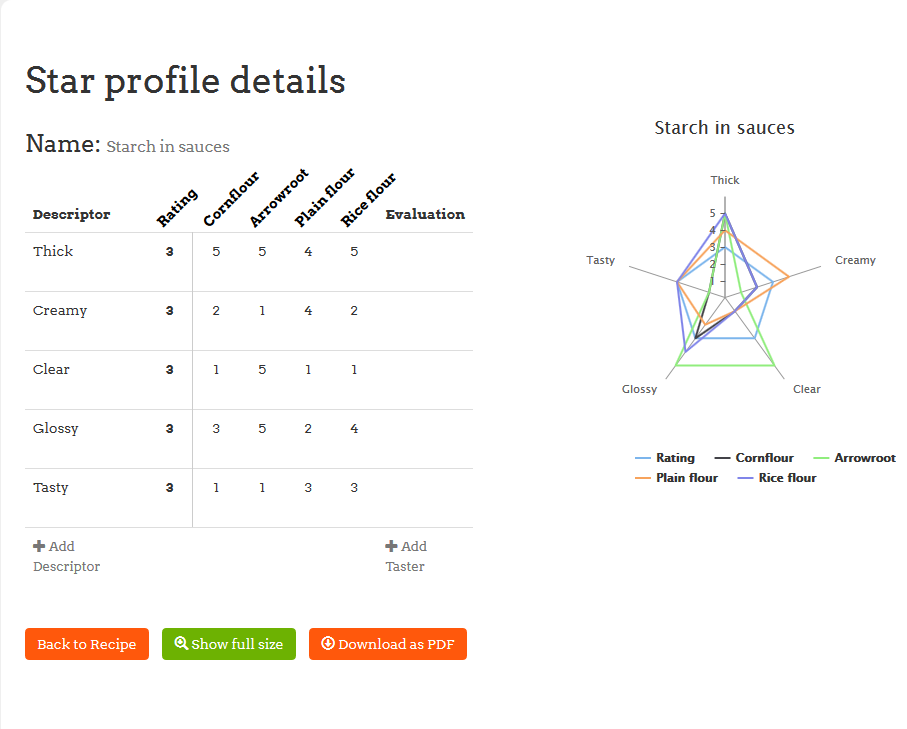
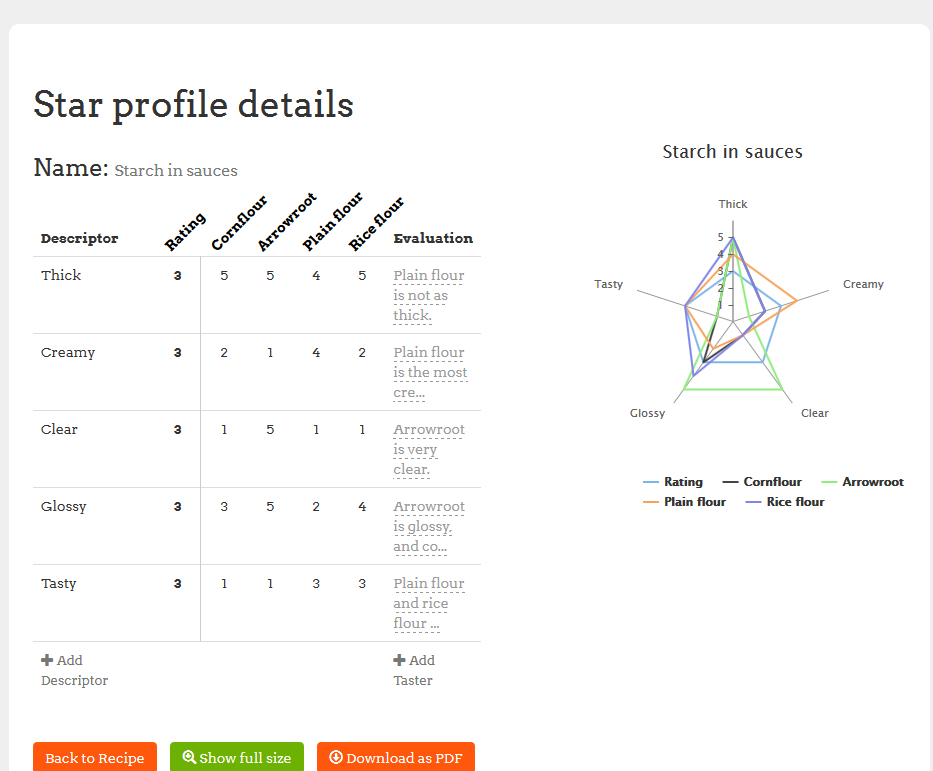
How to analyse star profile for pastry
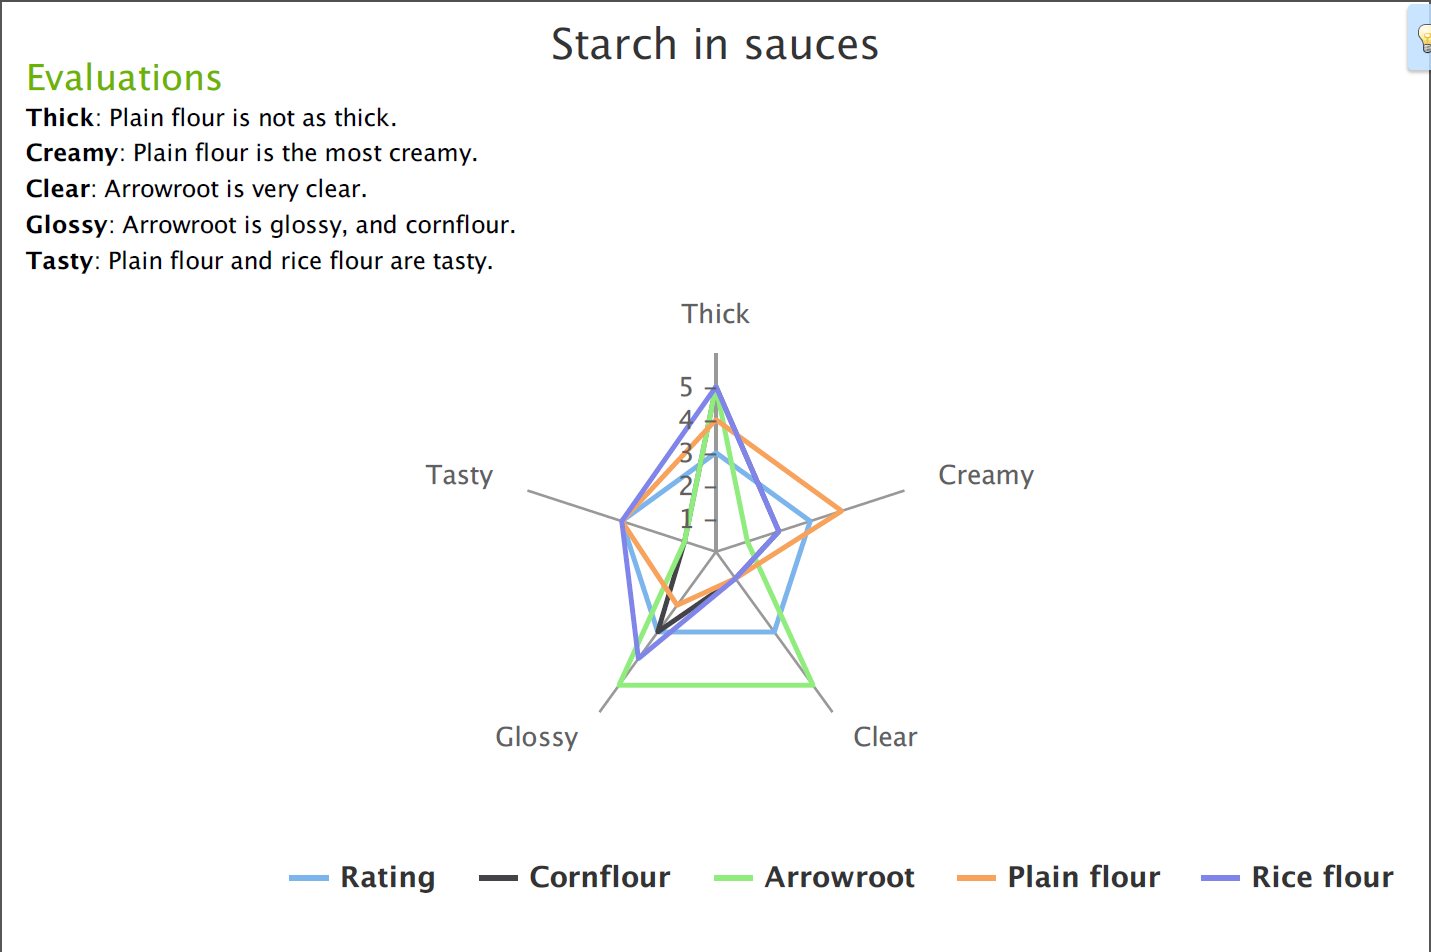
Fats in pastry 2

Results of tasting

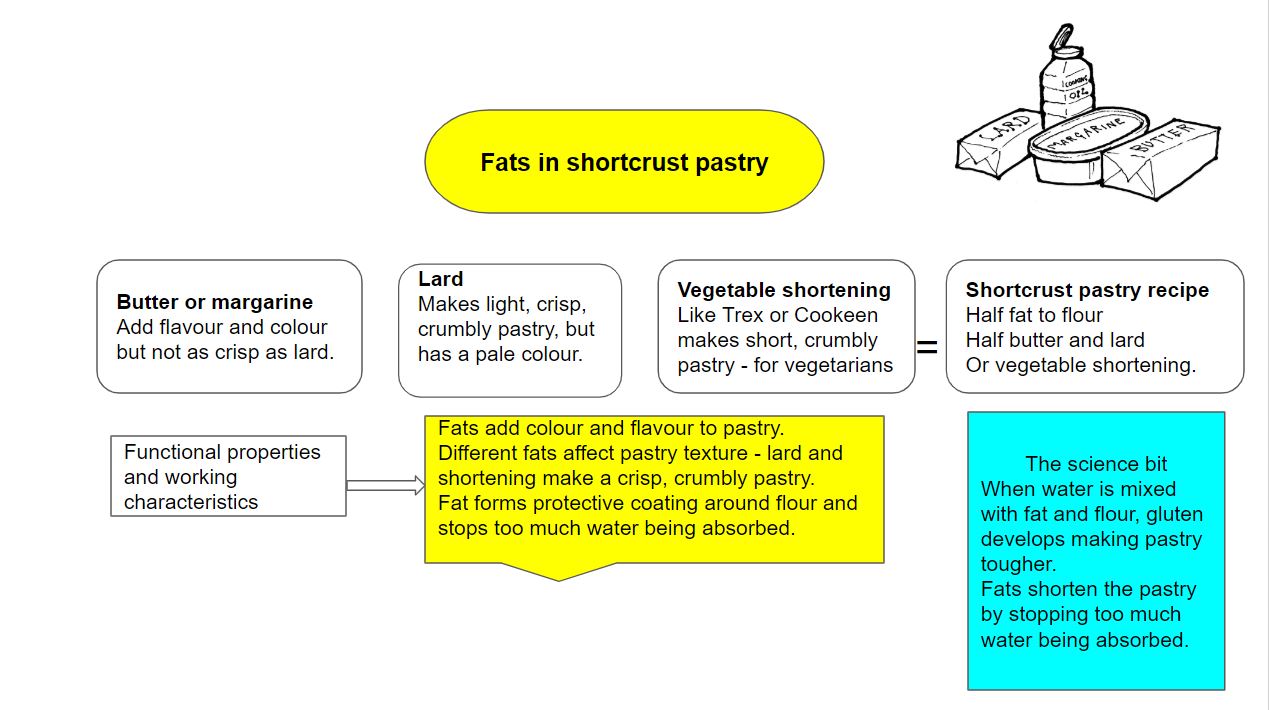
Lard – short, crisp, tasteless, v crumbly

Butter – good flavour, quite short

Trex – light, crumbly, short, delicious

Oil – tough, dry, a little crumbly and hard.

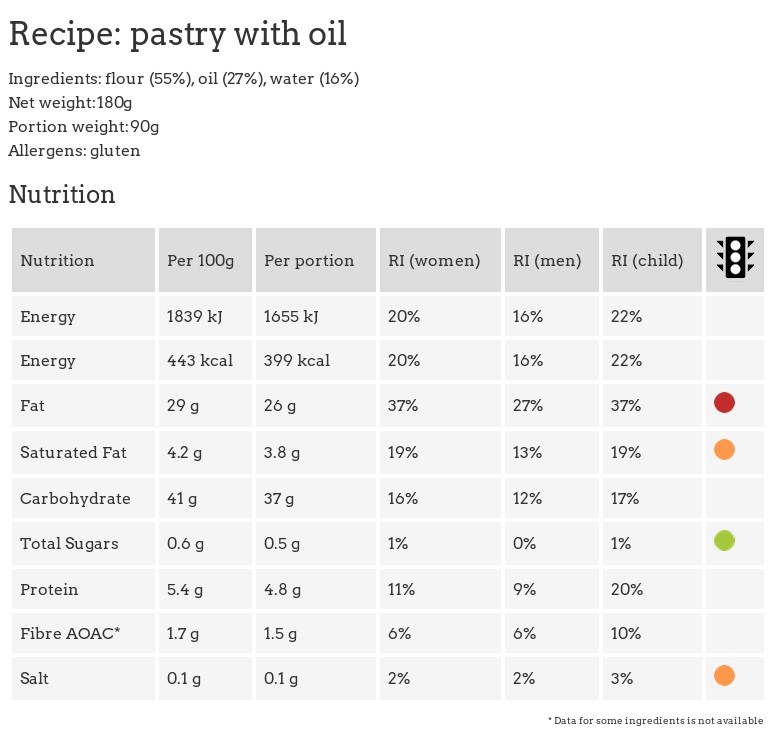
Put the recipes into the Nutrition Program and compare results – Butter pastry, lard pastry, oil pastry, Trex pastry

This second video tells you how to finish the star profile

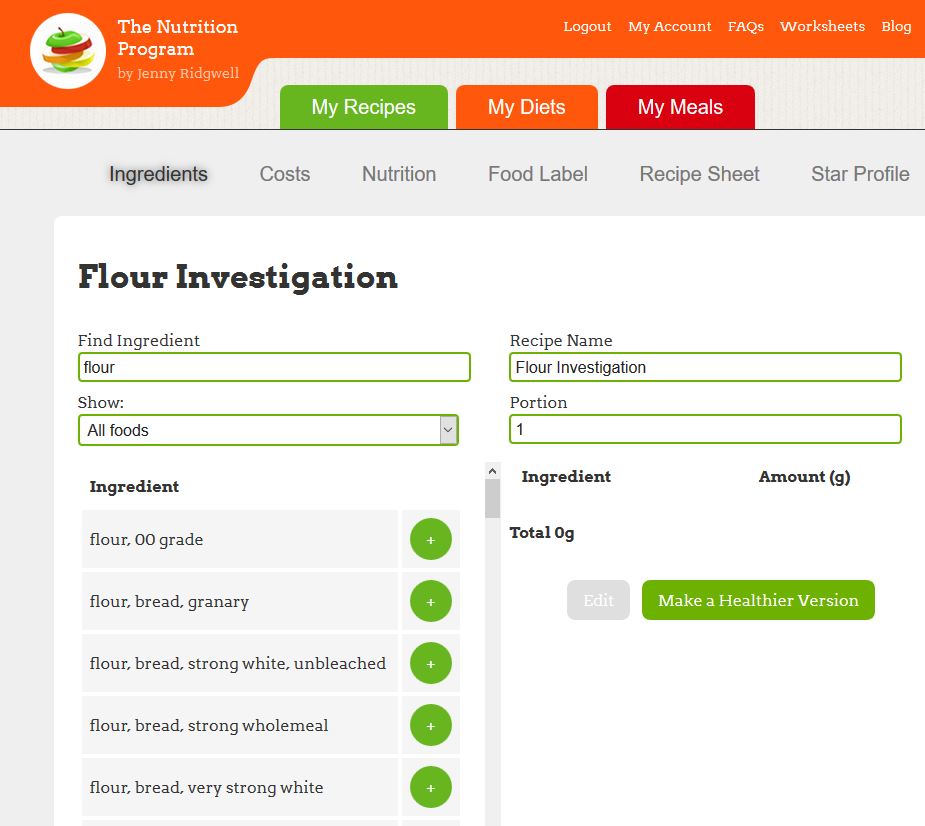
This Youtube video shows how to create a recipe

How to create a recipe

Use basic recipe 100g plain flour, 50g fat ( you choose) 30g water.

Plot the results on a chart

Take photos and annotate

Cooked pastries – annotated

Chart shows fat and saturated fats in pastries

New books coming from Ridgwell Press for NEA 1 http://www.ridgwellpress.com

Nutrition analysis, star profile and costing

 Nutrition Program can be used to create a recipe label, star profile and costing.

  • Recipe sheet
  • Recipe label
  • Star profile
  • Nutrition analysis
  • Costing

Apple pie food-labelStar profileApple pie nutrition


Nutrition for apple pie

Costing for apple pie

Gelatinisation of starch – NEA 1

Food and Nutrition GCSE has an Investigation NEA which could be

Investigate the ingredients used to thicken sauces and soups

Look at the Book NEA 1 Food Investigations

This is how I do it:
Think what ingredients are used to thicken sauces and soups and which starch is best for recipes.

White sauce, Tomato sauce or soup, Fruit sauce…

Starchy ingredients thicken sauces when they are heated in liquid.

So test some starches:
Rice starch, cornflour, plain flour, arrowroot, potato flour … you choose.

Create a FAIR TEST. Mix the same amount of starch (10g) with the same amount of water (100ml).

Heat each one in the microwave and look every 20 seconds, stir and remove when it is thick.

Taste and test each one.

Use the Star Profile on the Nutrition Program to show your results:

First list the starches, then choose Descriptors – words to describe the results – thick, creamy, clear, glossy, tasty …

Different starches and gelatinisation
This star profile from Nutrition Program shows tasting results
This star profile shows tasting results

Fill in your tasting results:-

This star from Nutrition Program shows the results
This star shows the results for the starches
This star shows the evaluations of gelatinisation
This star from the Nutrition Program shows the evaluations of gelatinisation
These are the final results of the starch test.
These are the final results of the starch test presented using The Nutrition Program.

Save

Save

Save

Save

Star profile on YouTube for Nutrition Program

Flour in bread – investigation NEA 1

This YouTube video shows how to use the Star Profile of the Nutrition Program to Investigate flours used for bread.

Set up a Star Profile to compare the different flours used in bread. Complete the Star Profile with your results.

Compare Flours for NEA on bread
Different flours – thanks to Dave Smith for image

The nutrition of different flours

The amount of gluten, the protein in flour, affects how the flour can be used in cooking.

  • Flours which are high in gluten are used for breads and pastas.
  • Flours which are low in gluten are used for cakes and scones and sauces.

Compare the protein content of different flours

Use the Nutrition Program for this investigation.

  1. Click My Recipes, +New Recipe and call it Flour Investigation.
  2. Find Ingredient Type flour and a whole list is shown.
Nutrition Program list of flours

If you want to look at what flours to use for bread choose 4-5 types

For example

  • flour 00 grade;
  • flour, bread, strong white;
  • flour, plain; flour,
  • self raising, white;
  • flour, gluten free.

Choose them each in turn – the screen shows the Macronutrients for 100 g.

Nutrition Flour 00 grade

To get nutrition for the next flour, Cancel and go back to Find Ingredient.

Collect screen images and put the results of protein in 100g on a table like the one below.

Nutrition strong white bread flour
FlourProtein in 100g
Flour 00 grade11g
Flour strong white bread13g
Flour, plain9.7g
Flour, self raising, white8.9g
Flour, gluten free bread flour, Doves farm4.8g

For NEA 1 research, compare the protein content – my results show that Strong, white bread flour has the most protein and so the most gluten which forms the structure of the loaf.

Use Food Science You Can Eat to help

Save

Save

Save

Save

Costing a dish

Costing a dish – see the You Tube video

Costing a recipe on Youtube

The cost of a recipe is worked out for a portion and the whole recipe. You can work out costs by hand, on a spreadsheet or using a computer program.

Cost of ingredients depends on

  • Where you shop – supermarket, local market.
  • How you shop – special offers, buy in bulk.
  • The quality of your ingredients – organic food costs more.
  • If you buy seasonally, or grow your own.

Terms from AQA Food and Nutrition GCSE requirements

  • To calculate the cost of the dish and compare with a commercial product.
  • Differentiated worksheets and home learning resources to calculate costs of spaghetti bolognaise or chilli.
  • Costings worksheet.
  • Work out the cost of ingredients to make chosen dish and compare to ready-meal tested.
  • Consider suitable recipe ideas, sourcing of ingredients to promote environmental and ethical awareness, nutritional profiles of recipes, costs, cooking and serving times.
  • Produce a recipe card of each of the dishes made listing the ingredients, method of making, nutritional profile, allergy advice, costing and special dietary, health or environmental claims.
  • Costing analysis worksheet.
  • Costings for each dish, analysed and explained
  • NEA 2 Section E Final dishes are costed with the results of this costing analysed and explained

    OCR statement NEA 2
  • Excellent consideration and understanding of the task including sensory and nutritional choice, cost, food provenance and seasonality

See how the Nutrition Program can do it for you!

  1. The recipe Feta stuffed peppers – serves 2
  • 2 peppers, any colour, cut in half (seeds removed)
  • 20g couscous
  • 10 black olives, chopped
  • 125g feta, cubed
  • 125g cherry tomatoes, halved
  • 1 small red onion, finely chopped
  • 1 tsp chilli flakes
  • 1 tsp oregano
  • 1 tsp celery seeds
  • 1 tbsp olive oil

2. Type it in My Recipes and go to Costs:

Costing a recipe3. At the bottom of the chart it shows the recipe costs £2.82 and the portion costs £1.41.

If you think any costs are too high or low, email me.

Save

Save