My list of essential equipment for investigations – things I have used for my experiments for NEA 1 Food Investigations 10 Tasks. This book will be available online to purchase soon. (mid Sept 2023)
Digital scales – you need accurate measurements for testing recipes
Digital scales
Food probe– use to test setting temperatures of egg mixtures, sauce thickening temperatures and cooking temperature.
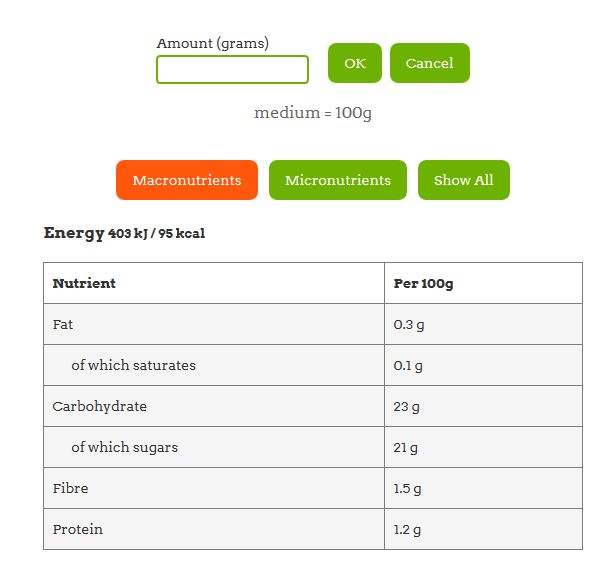
Nutrition Program! – use to find the nutritional value of flours, sugars, beans, … to help you make choices for foods to investigate.
Digital camera – use your phone
Use phone to capture images
measuring cylinder
NEA 1 Food Investigations 10 Tasks.
This book will be available online to purchase soon. (mid Sept 2023)
For NEA 1 you need to evaluate and annotate your results. Here’s how to do it using the Nutrition Program.
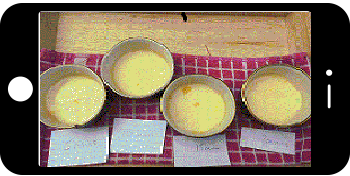
The Task – To discover what happens if you reduce the sugar in a sponge cake recipe.
We made cakes with full amount of 60g sugar and then did a batch with 50g, 40g, 30g.
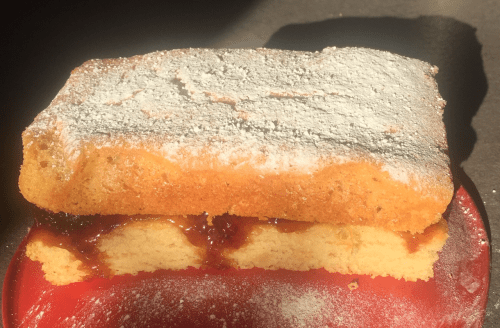
You can evaluate the Functional properties of sugar in cakes – the purpose for which the ingredient is being used and can be linked to – its structure, nutritional value, taste, texture, appearance, shelf life.
Star profile from Nutrition Program to show evaluation of results of reducing sugar in cakes.
How to do this
Create a recipe for your sponge cake in My Recipes.
Bake and compare your cakes and then click Star Profile
Name the recipe ‘Star profile sponge cakes’.
Choose descriptors – how the cake should look and taste. The descriptors we chose were – golden, yellow sponge, open texture, moist, dry.
The Control cake was marked golden (5), yellow sponge (4), open texture (4), moist (4), dry (1) – this was our perfect cake.
Taste the cakes and mark them on the chart – tip in the +Add Taster put the name of the cake – for example, full sugar, 50g sugar.
The Nutrition Program Star Profile fills in – now you need to Evaluate the results under Evaluation – see our chart.
To get extra exam marks you can annotate the Star profile.
This shows an example of annotating a Star Profile to show what the results mean.
Task
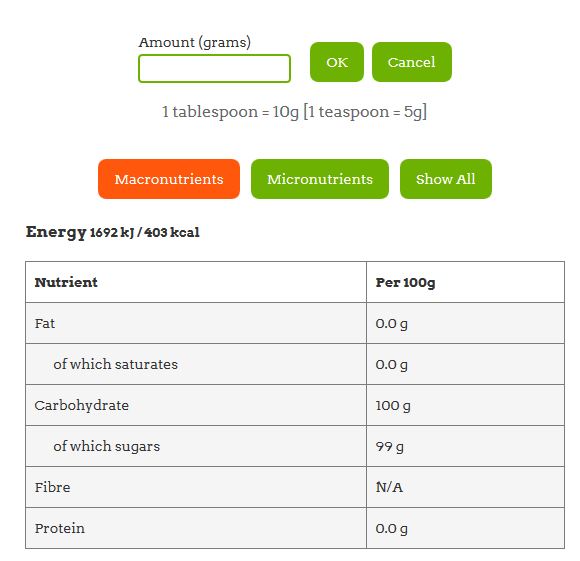
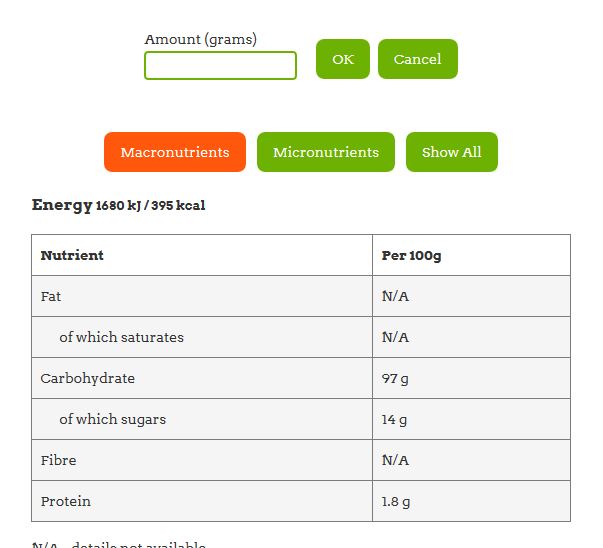
Compare the nutrition of sweeteners for cakes and desserts – use for experiments changing the types of sweetener used in cakes and desserts.
We are told to reduce the amount of ‘free sugars’ in our food, especially cakes and desserts.
But how easy is this to do and how much sugar is found in ingredients used for sweetening?
Compare the sugar content of different ingredients
Ten Tasks explore how to carry out Research, Investigation, Analysis and Evaluation for each Task for all exam boards.
Tasks – thickening sauces, raising agents, fats in pastry, flours in pastry, bread, pasta, cakes, changing sugars in cakes, eggs for setting and foams
All linked to science.
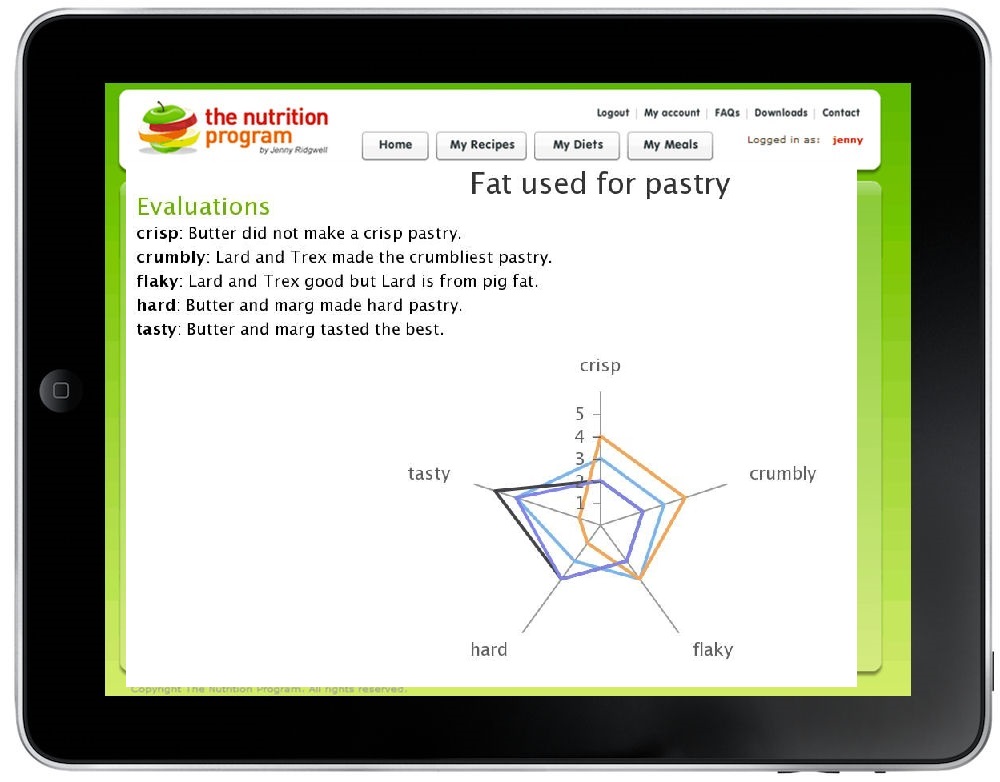
Shortcrust pastry changing the fats
NEA1 Ridgwell Press
Great resource!“I have used this to teach my students about Food Science. The book is very easy to follow and the experiments very accessible to students, it ideal for my GCSE classes.”
Make a star profile to compare resultsStar profile
Step by step on how to use Nutrition Program to show nutritional value of recipes for different age groups.
I’ve chosen Fish cakes made with salmon and potato and served with tartar sauce.
First create the recipe in My Recipes. The Nutrition Program shows the nutrition for 100g and a portion. You can get this image by clicking Print.
You may want the cost of the recipe – just click Costs and do a screen grab.
Nutrition Program shows Costs for 100g, per portion and for the recipe
If you want to look at RI Reference Intake, go to Nutrition, scroll to bottom of screen and the bar chart pops up for RI woman, RI man and RI 5-10 year old.
Reference Intake bar chart
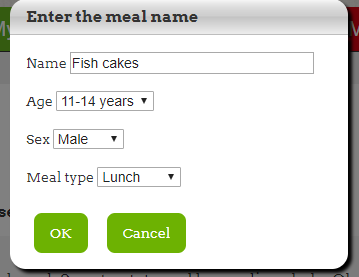
If you are making the dish for a child, teenager or adult, and you need the nutrition for that age group, go to My Meals.
Create a new meal – you could call it Fish Cakes – My example is for 11-14 year olds, Male, Lunch
Nutrition analysis teenager
In Find Recipe, add Fish cakes with tartar sauce which you saved in My Recipes.
Click Nutrition and you will see how the Fish cakes meet the needs of a meal. In this cake they provide 63% of meal intake which is good as you would serve other vegetables and a dessert or starter.
You can see from the traffic lights that this dish is a bit high in fat, so you can change the recipe.
We are told to cut down on salt but sodium is listed on food labels so how do we convert?
Sodium to salt
To convert sodium to salt, multiply the sodium figure in milligrams (mg) by 2.5 and then divide by 1,000. So: millgrams of sodium X 2.5 = milligrams of salt ÷ 1,000
Eating too much salt increases your risk of developing high blood pressure which is a major risk factor for heart disease.
Thanks to the brilliant Dave Smith for this artwork
Too much salt is harmful to health
News Flash – Food labelling is changing
By December 2014 all food labels will only list salt -sodium will not be listed. This will make it much easier for you to see how much salt each product contains.
Choose lower salt options using the following guidelines on food labels:
A food high in salt has more than 1.5g salt per 100g (or 0.6g sodium).